GWAS, PheWAS, and Mendelian Randomization
Understanding Methods of Genetic Analysis


GWAS
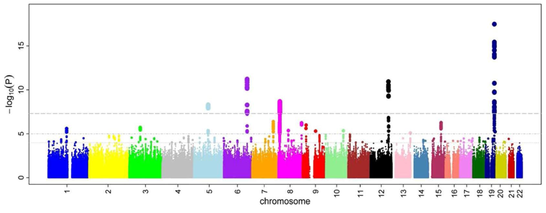
Genome Wide Association Studies (GWAS) look for genetic variants across the genome in a large amount of individuals to see if any variants are associated with a specific trait such as height or disease. GWA studies typically look at single nucleotide polymorphisms (SNPs), which are germline substitutions of a single nucleotide at a specific position in the genome, meaning that these are heritable differences in the human population. A GWAS is performed by taking DNA samples from many individuals and using SNP arrays to read the different genetic variants. If a particular variant is more present in people with a specific trait, the SNP is associated with the disease. Results from a GWAS are typically shown in a Manhattan plot displaying which loci on the various chromosomes are more associated with a specific trait. In the picture below taken from Wikipedia, each dot represents a SNP, and "this example is taken from a GWA study investigating microcirculation, so the tops indicates genetic variants that more often are found in individuals with constrictions in small blood vessels."
A GWAS is a non-candidate-driven approach, in that a GWAS investigate the whole genome and not specific genes. As a result, a GWAS can tell the user which genes are associated with the disease but cannot describe any causal relations between the genes identified and the trait/disease being studied.
Methodology
Typically, two general populations are used for a GWAS, a case group with a certain disease and a control group without the disease. The individuals in the population are genotyped for the majority of known SNPs in the human genome, which surpass a million. The allele frequences at each SNP are calculated, and an odds ratio is generated in order to compare the case and control populations. An odds ratio is "the ratio of the odds of A in the presence of B and the odds of A in the absence of B", or in the case of a GWAS, it is "the odds of case for individuals having a specific allele and the odds of case for individuals who do not have that same allele".
For example, at a certain SNP, there are two main alleles, T and C. The amount of individuals in the case group having allele T is represented by A, or 4500, and the amount of individuals in the control group having allele T is represented by B, or 2000. Then the number of individuals in the case group having allele C is represented by X, or 3000, and the individuals in the control group having allele C is represented by Y, or 3500. The odds ratio for allele T is calculated as (A/B) / (X/Y) or (4500/2000) / (3000,3500).
If the allele frequency is much higher in the case group than in the control group, the odds ratio will be greater than one. Furthermore, a chi-squared test is used to calculate a p-value for the significance of the generated odds ratios. For a GWAS, typically a p-value < 5x10^-8 is required for an odds ratio to be meaningful.
Furthermore, factors such as ethnicity, geography, sex, and age must be taken into consideration and controlled for as they could confound the results.
Imputation
Another key facet used in many studies involves imputation, or the statistical inference of unobserved genetic sequences. Since it is time-consuming and costly to do genome wide sequencing on a large population, only key areas of the genome are typically sequenced and a large portion of the genome is statistically inferred through large scale genome datasets such as the HapMap or 1000 Genomes Project. Imputation is achieved by combining the GWAS data with the reference panel of haplotypes (HapMap/1000 Genomes Project) and inferring other SNPs in the genome through shared haplotypes among individuals over short sequences. For example, if we know that a patient with an A allele at base 10 always has a G allele at base 135, we can impute this information for the entire population. This method increases the number of SNPs that can be tested for association in a GWAS as well as the power of the GWAS.